
Inequality
I've been thinking a lot about inequality lately. I kept reading report after report on American inequality but it was hard to visualize the chasm between the rich and the poor. Then I saw a video on inequality that helped me make sense of it all. I wasn't even half way through the video when I knew I was going to share it with my students.
Here's a recipe I cooked up to help my students debrief from the video and think deeply about inequality.
Time
15 minutes preparation
45 minutes of class time
Ingredients
100 beans per group of 4
1 ruler per group of 4
1 piece of paper per group of 4
1 marker per group of 4
1 link to the great inequality video (6 minutes and 24 seconds)
Before
Get 100 dried beans, or a roll of 100 pennies, or, in a pinch, chop up a piece of paper into 100 little pieces. We’ll refer to these pieces, beans, or pennies as beans from now on.
Class
Individuals
Ask your students to write down the word wealth.
Ask them to write a definition of the word wealth.
Wealth = what you have minus what you owe
Wealth = your stuff - your debts
The median net wealth of Americans is now somewhere around $57,000.
Groups
Split your class up into groups of four or so.
Each group will need
100 beans.
1 ruler
1 piece of paper
1 marker
Each group will take a piece of paper and a ruler. Turn your paper long way and place your ruler flush with the left hand side of your paper. Mark a line at 2 inches that runs from the top to the bottom of the page. Mark another line at 4 inches, another line at 6 inches, another line at 8 inches and a final line at 10 inches. You’ve marked your paper, roughly into quintiles (fifths). If you imagine dividing the US into quintiles of wealth, the poorest quintile of Americans would be in the space between 0 and 2 inches. The richest quintile of Americans would be between 8 and 10 inches. You can cut the paper off or fold it back at the 10 inch line.
Think of the beans as the total wealth of the USA. Each bean equals one percent of the total wealth. The total wealth of the US is approximately $54 trillion (2008) and that means that each bean is worth approximately $540 billion which written out looks like this $540,000,000,000 (that’s five hundred and forty billion dollars).
How do you think wealth (beans) is distributed in the USA?
In other words, you would put 20 beans in each quintile if you think the wealth is distributed exactly evenly between quintiles.
Or, your would put all 100 beans on the top quintile if you think the richest quintile (fifth) of Americans have all the wealth.
Remember, these beans do not equal income. Income is how much money you make. We are talking about wealth - how much a person has accumulated in life.
Distribute the beans on your grid based on how you believe the beans are actually distributed in the USA today.
After you’ve distributed the beans on your grid talk about it as a class. Talk about why some people get more beans than others. Talk about what it takes to get beans and to not get beans. Think about justice, fairness, equality, history.
Write the words AS IS on a piece of paper, place it at the top of the grid, and take a picture of your USA grid.
Now, let’s try this again.
Think again of the beans as the total wealth of the USA. Each bean equals one percent of the total wealth.
This time, think about how you think wealth (beans) should be distributed in the USA? Not how it IS, but how it SHOULD BE in an ideal world. Now talk about it. Thinking again about questions of justice, fairness, equality. Write the word SHOULD BE on a piece of paper, place it at the top of the grid, and take a picture of it.
Discuss how different your second grid is from the first grid you made and why that is.
Watch the great inequality video (6 minutes and 24 seconds)
After you watch the video each student should write down the following.
Something new you learned in the video.
A statement about how fair the United States is.
A statement about what the government could do about the distribution of wealth in the US.
Discuss why the distribution of wealth is the way it is.
Discuss what the government could do about it.
Rearrange the beans on your chart to reflect how wealth is actually divided in the US. Write the word ACTUAL on a piece of paper, place it at the top of the grid, and take a picture of it.
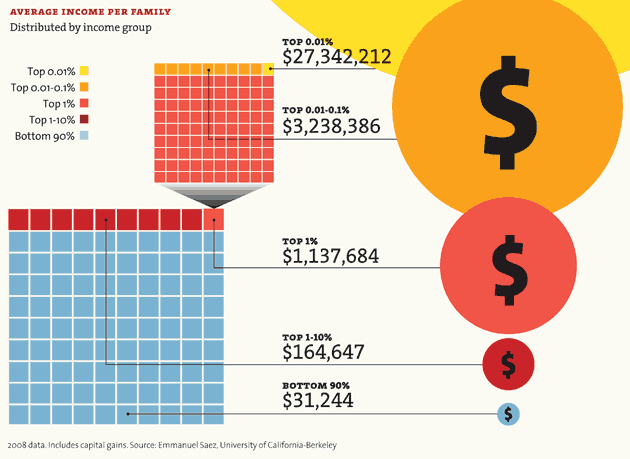
Here’s a chart that summarizes the findings from the video

After
Do one of the following:
Send me your pictures of your grids and thoughts.
Write a one page letter to the editor about the video.
Make a one paragraph post responding to the video on You Tube.
Make a one minute video response to the video on You Tube.
Write a letter to a government official about the video.
Make a post on this blog about the class.
Write a song, rap, or poem about the distribution of wealth in America.
Make a video response to the the great inequality video
Use your beans to make a visual representation of the USA (this could be a flag, a symbol, a word).
Complete this analogy. America is to equality, as ______________ is to _______________ . Make art from your analogy.
Thanks!
Further study
Infographic on income inequality in the US
Here’s a 11 charts from Mother Jones on Inequality