EnthUSAiasm
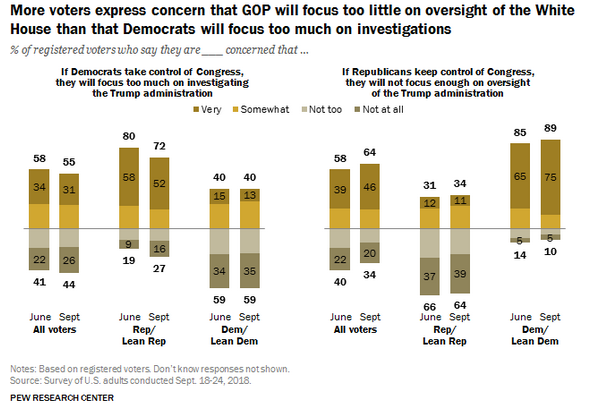
Which party is more enthusiastic about this year’s midterm elections?

How accurate was your prediction?
What is the big story this graph tells?
Why do you think that is?
What is one consequence of this year’s enthusiasm gap?
Take the graph above and write the name of the president for each of the midterm elections.* How does the president’s party impact the enthusiasm of midterm voters by party?
Take the graph above and write the amount of seats lost by the president for each of the midterm elections.* How does the president’s party fare in midterm election?
How has the tend in the chart changed over the past 12 years?
Why do you think Democrats are so enthusiastic about this year’s elections?
President Trump is not running for office in 2018 (now), but in a way he is. President Trump has about a 40% approval rating. How do you think that will impact the midterms?
How do you think Senators up for reelecton in red (Republican) states, Senators up for reelection in blue (Democratic) states, and Senators up for reelection in purple (toss-up) states will differ in their campaigns.
How do you think that 12% enthusiasm gap between the parties will impact this year’s midterms?
Do you think there is anything President trump can or will do between now and the Tuesday, November 6 election to get his base (super-Republican voters) riled up (excited to vote)?
Do you think Trump nominated a more extreme Supreme Court nominee like Brett Kavanaugh right before the midterm election to rally his base (get his supporters fired up)? Do you think
Democrats in the House and Senate fought so hard against Brett Kavanaugh to rally their midterm electoral base?
Imagine that the Democrats take control of the House and the Senate in the 2018 midterm elections. How does that impact how Trump governs?
How does that impact how they treat Trump?Imagine that Donald J. Trump gets reelected in 2020. How does that graph look in 2022?
Imagine that Kamala Harris (D) gets elected in 2020. How does that graph look in 2022?
What particular issues are riling up Republicans and Democrats right now?