
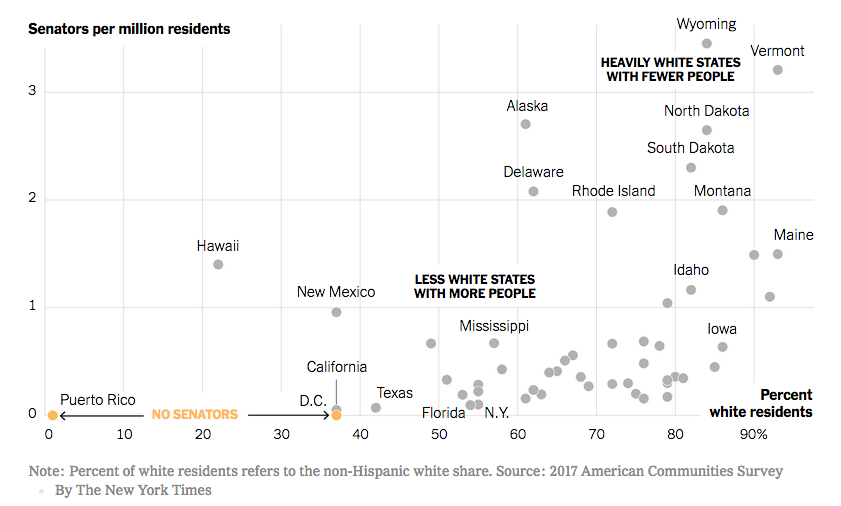
Senate So White

Critical Analysis
White Americans are better represented in the U.S. Senate than any other racial group. What group has the least representation?
What story does the chart tell about race and power in America?
Explain why this racial disparity in representation exists?
What is one political consequence of this disparity?
Explain whether this disparity would be the same in the House of Representatives.
In a democracy, all people are supposed to be equal. Does this chart show that all people in America are equal?
Describe a connection between the data from this chart and the Connecticut Compromise.
What could remedy the inequality described in the chart?
The author of the chart above proposes that D.C. and Puerto Rico become states. How would that impact the data from the chart?
Describe one policy change that would likely happen if all racial groups in America were represented equally?
One student responded to this chart by making the claim that it doesn’t matter what race of politician represents a state or district as long as they do what is best for the country. Respond to this claim.
Learning Extension
Read David Leonhardt’s NYTimes editorial, The Senate: Affirmative Action for White People to learn a bit more about how racial disparities in politics works.
Action Extension
Read the comments on David Leonhardt’s NYTimes editorial, The Senate: Affirmative Action for White People then leave your own comment.
Visual Extension

Prepare for the 2026 AP® US Government Exam with High Five! Our Exam Review guide is completely redesigned and updated with over 140 pages of great AP Exam review material. Tons of completed graphic organizers are full of information to get you exam-ready in a flash.
This 2026 exam guide is an instant download and contains all the following resources.
Overview of the U.S. Government and Politics exam.
Completed graphic organizers for all required documents + Supreme Court cases.
Guide to the skills and content for all 5 course units.
Essential vocabulary with link to online glossary.
Tons of Graphic Organizers with answers from each course unit.
GoPo Pro Tips and checklists.
Exam review Guides.
Amazing AI generated images of the Framers of the Constitution giving high fives!
Full Length AP multiple choice + Free Response Exam with Key.
AP ® is a trademark registered by the College Board, which is not affiliated with, and does not endorse, this site or product.
GoPoPro does not offer credit or grades for our classes or products.