Education and Voter Turnout
What percentage of citizens of voting age (18) with less than a high school diploma voted in the 2016 election?
How accurate was your prediction?
Describe one trend from the chart related to levels of education?
Why do you think that is?
What is one consequence of this trend?
What group listed in the chart voted the most?
Why do you think that is?
What are two obstacles to voting that are more likely to be present for people with less education than for people with more education?
Do you think that it is bad news that more educated people vote more than less educated people?
When you think about the people you know and their education levels, does the data in the chart mirror the people you know?
Regardless of education level, what tends to happen to election turnout every two years?
Why do you think that is?
What is one policy that you image would change if people with higher education voted less and people with lower education voted more?
How do you think other demographics (age, income, race) impact voter turnout?
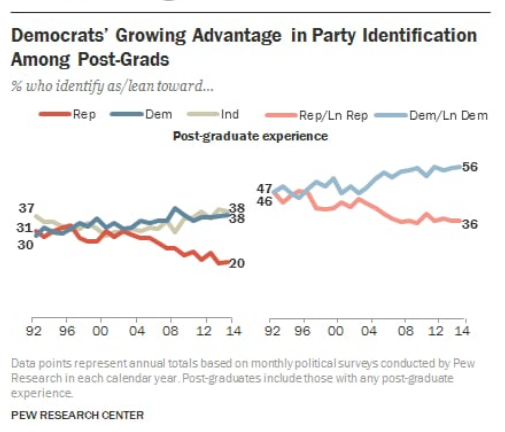
We know how education impacts the likelihood of voting. How do you think education levels impact which party people vote for?
Why is there not data for how non-citizens vote?????
What questions do you have about this?
Learning extension
Read this Guardian story about voter turnout and education in the 2016 election.
Action Extension
Make a poster or sign aimed at convincing someone with a less than a high school diploma to vote in the 2018 midterm election. Put your sign up!


