Youth Midterm Turnout
Critical Analysis
According to the data from the visual above, what portion of young people age 18-29 cast a ballot in the 2022 midterm election?
According to the data from the visual above, what year had the lowest midterm election voter turnout of young people age 18-29?
Based on the data from the visual above, describe one trend in youth midterm voting since 1994.
What is the best explanation for that trend?
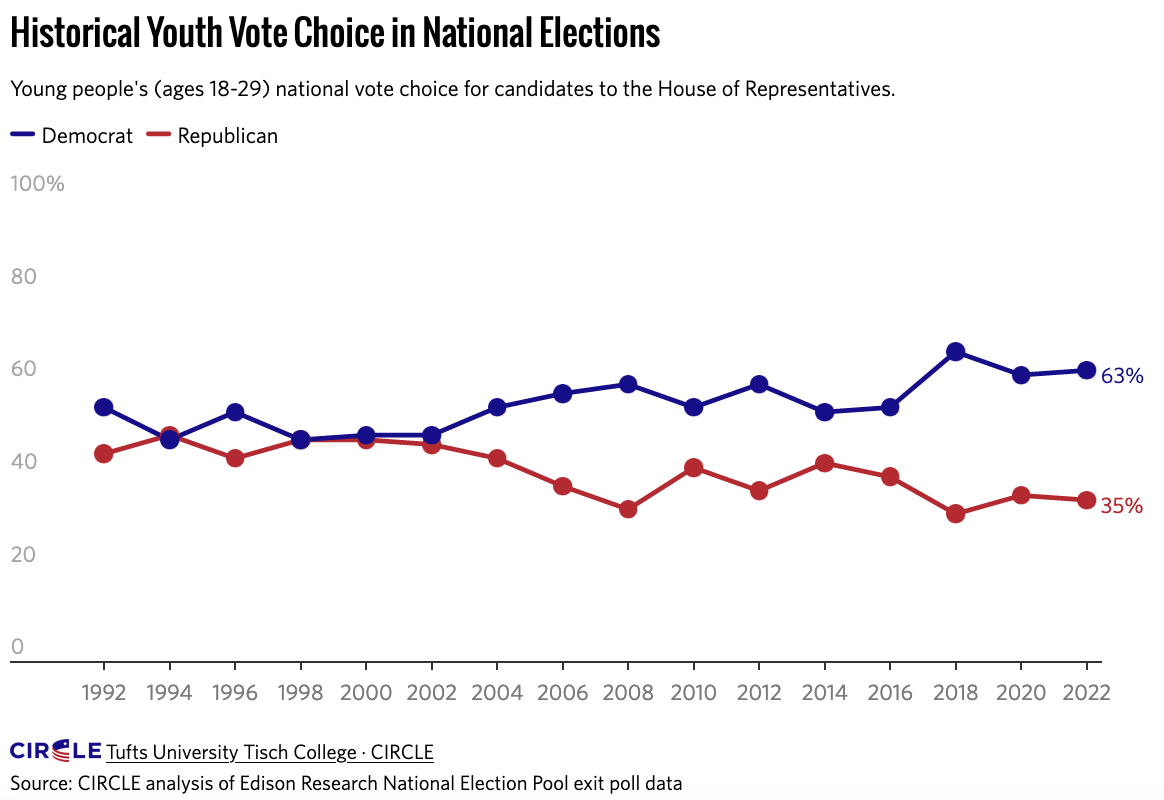
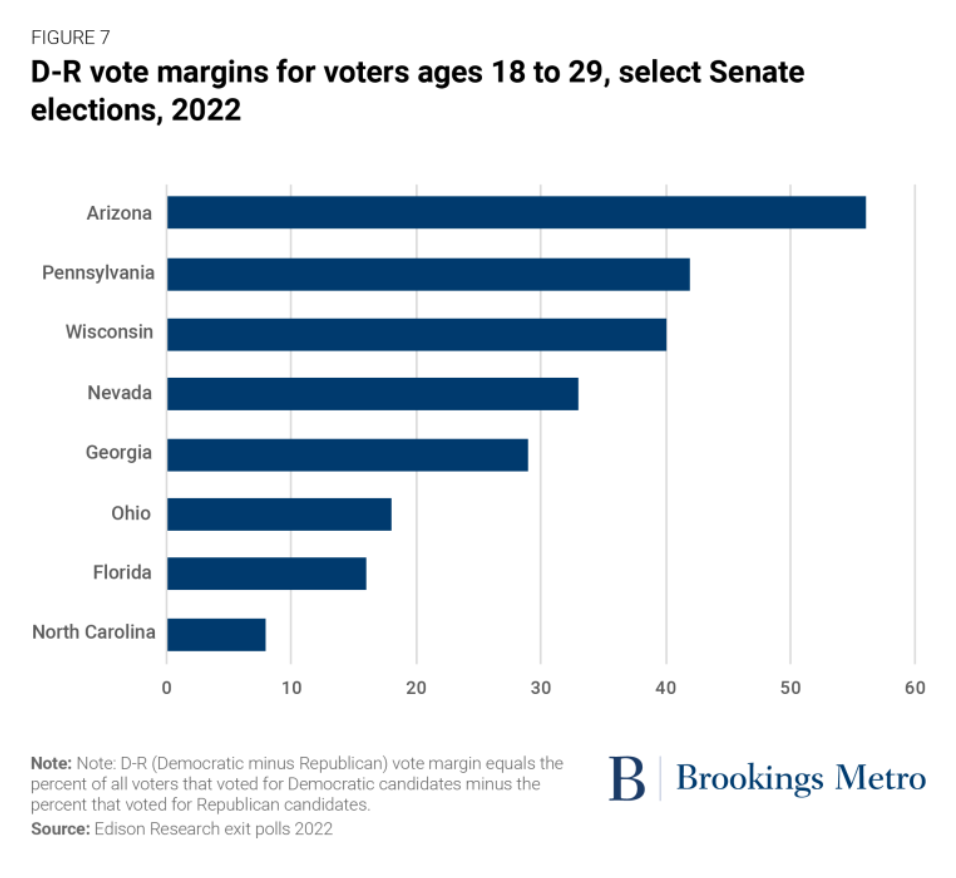
Based on the visual below,* the majority of young people support what political party?
Why do you think that is?
Based on the visual below,* if only young people voted, what party would win every time?
Based on the visual below,* how did the youth voter turnout compare to the overall voter turnout?
Based on the data above and below, what do you think will happen in the 2026 midterm election?
What information, not included in the chart above, would you need to know to make a better prediction about the outcome of the election?
Learning Extension
Learn a bit more about the youth vote from CIRCLE.
Action Extension
Contact your U.S. House Representative, mine is Kathy Manning, and ask them what they are doing to win the youth vote in 2024.
Visual Extension*
Get AP exam-ready with diagnostic tests, online review games, test review sheets, practice quizzes, full-length practice exam, and self-guided writing workshops. We'll make studying a breeze.


