Gender Gap, Education Gap, Age Gap, Baby Gap

AP US Government and Politics

Is there a bigger gender gap, education gap, or generation (age) gap between Democrats and Republicans?

  1. How accurate was your prediction?

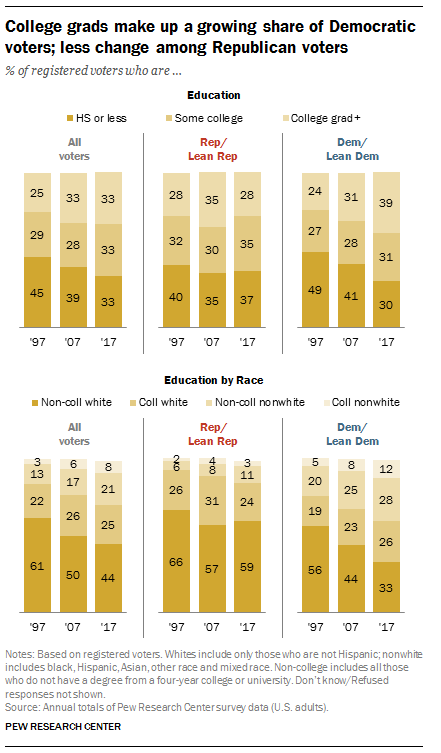
  2. What is a major trend over time that you see in these charts?

  3. Describe one cause of that trend.

  4. Describes one consequence of that trend.

  5. Is this good news for our political system?

  6. How do you think this data impacted the 2016 election?

  7. Does the data accurately reflect your own experience?

  8. As the Pew Research Center noted in their 2016 report on party affiliation, the composition of the Republican and Democratic electorates are less alike than at any point in the past quarter-century. How many people do you know who are of a different party affiliation from you?

  9. If these trends continue, what will these gaps look like in 20 years?

  10. According to research, most voters registered as independents are not truly independent, and consistently lean toward one of the major parties. Why do you think people who are not truly independent still register as independent?

  11. Describe one policy that explain why the majority of women are Democrats instead of Republicans.

Learning Extension

Check out these super-cool interactive charts of party identification by demographic.

Action Extension

In 2000, my siblings and siblings in-law were evenly divided in political party affiliation. Today, we are all completely of the same political party. Survey your family and find out how many members of your immediate family are of different political parties. Then make a survey of your closest friends and find out how many members of your cohort are of different political parties. Share your results in class or online.

Data Extension

Today, a 56% majority of women identify as Democrats or lean Democratic, while 37% affiliate with or lean toward the GOP.

Voters who have completed college make up a third of all registered voters. And a majority of all voters with at least a four-year college degree (58%) now identify as Democrats or lean Democratic, the highest share dating back to 1992. Just 36% affiliate with the Republican Party or lean toward the GOP.

African American voters continue to affiliate with the Democratic Party or lean Democratic by an overwhelming margin (84% Democrat to 8% Republican). Hispanic voters align with the Democrats by greater than two-to-one (63% to 28%), while Asian American voters also largely identify as Democrats or lean Democratic (65% Democrat, 27% Republican).

Overall when their partisan leanings are taken into account, 50% of registered voters identify as Democrats or lean toward the Democratic Party, while 42% identify as Republicans or lean toward the GOP.

Read more at the Pew Research Center.

Visual Extension

Screen Shot 2018-03-20 at 4.27.31 PM.png
Screen Shot 2018-03-20 at 4.27.42 PM.png
Screen Shot 2018-03-20 at 4.27.54 PM.png
Previous
Previous

Make the Judiciary Great Again

Next
Next

Guns don't kill gun laws, the NRA does