American Race
Critical Analysis
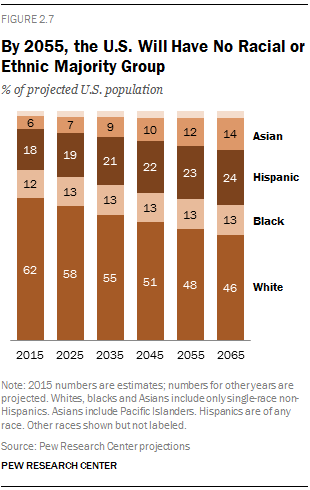
According to the data from the chart above, what is the largest racial minority group in America?
According to the data from the chart above, in 1965, what percentage of all Americans were White?
If demographic trends continue, at some point, American will become (like California is now) minority-majority. In other words, Whites will still be the biggest group (plurality) but they will not longer be more than half of the population (majority). Approximately what year will this happen?
Describe one trend from the chart above.
How does the information in the chart impact the following linkage institutions such as elections, campaigns, voting, and political parties?
In what way are the changes expressed in the chart reflected in your own life and community?
Make a prediction for what this chart will look like in 2080 America (if there is a 2080 America), then describe the changes in U.S. policy that would be a result of that.
My student, Esméralda, said that a direct consequence of the data in the chart was the election of Barack Obama and the election of Donald Trump. Explain how both those things could be true.
Explain how the projected American racial changes will impact overall American political culture and values?
In Letter From Birmingham Jail, Dr. Martin Luther King, Jr. defends the use of civil disobedience to fight for civil rights. Based on his letter, explain what you think Dr. King’s position on fighting for equal rights would be today.
Learning Extension
Check out these 10 charts on the changing face of America. Then do yourself a favor and dive into the 1619 Project from the NYTimes. And you can find curriculum developed by the Pulitzer Center at pulitzercenter.org/1619.
Action Extension
Research the demographics of your county or city and make a comparison of your local data with the national data. Make a post comparing your hometown to the nation at large on social media with the hashtag #changingamerica


